Live Feed
Idalia made landfall as a major hurricane this week in a season where we’ve been anticipating what might become of a Battle Royale between the anomalously warm seas in the Atlantic and an ongoing El Niño in the Pacific. A reminder: we’re not even climatologically half way through the season yet…
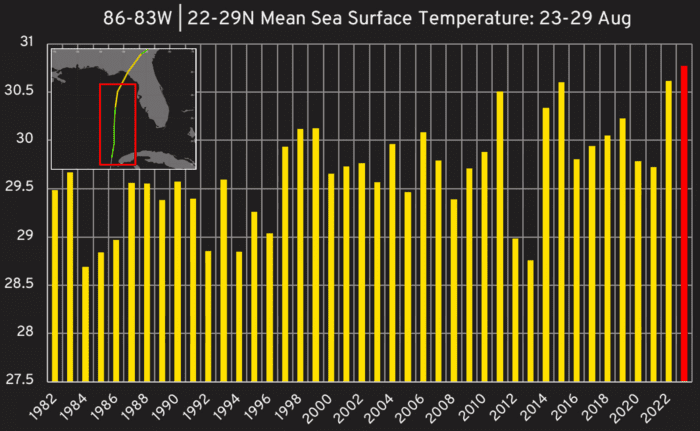
Taking a look at the sea surface temperatures in the Gulf of Mexico, it’s little surprise we saw a strong landfall: in the week leading up to Idalia, the sea in its path was the warmest it’s been in since 1982 (when this particular sea temperature dataset started). The chart here shows the average sea temperature for the period of Aug 23-29th for every year for the past 40 years in the red box shown that broadly straddles the region through which Idalia passed and developed. Naturally other factors will always influence how a storm develops, but you don’t typically get the heavy-hitters of hurricanes without the warmer seas.
And now for the rest of the season…
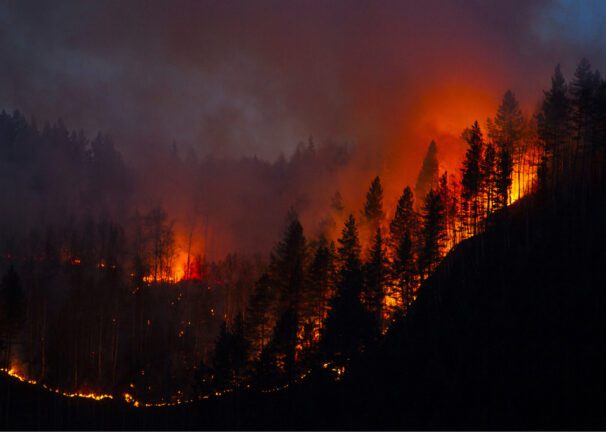
Lahaina, located on the northwest coast of the Hawaiian island of Maui, experienced a devasting wildfire in August 2023. Several factors likely contributed to the severity of this wildfire including enhancement of strong easterly winds by Hurricane Dora, Katabatic winds flowing from the West Maui Mountains, located to the east of Lahaina, and drought conditions.
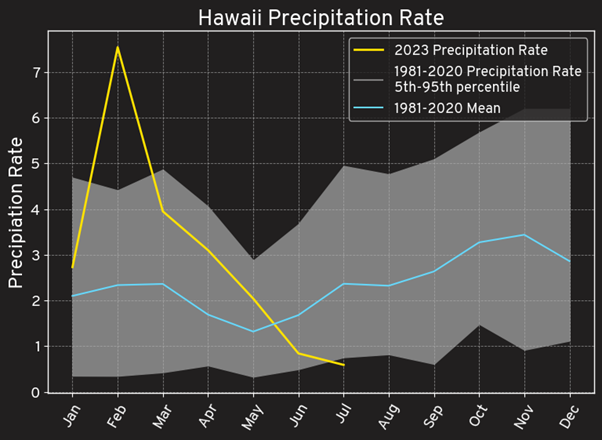
The precipitation rate for all of Hawaii has been extracted from the NCEP Reanalysis data between 1980 and 2023 and is shown in the graph. The precipitation rate for February 2023 was the highest recorded since 1980 at nearly three times the average. Precipitation rates throughout the spring were above average but by June it is below average, with July being extremely dry in the bottom 5% of years.
The February and spring rainfall likely contributed to a growth of vegetation. During dry seasons an increase in fuel availability contributes to the wildfire risk. Precipitation rates over Hawaii have been well below normal for June and July leading to drought conditions across Hawaii. According to the US Drought Monitor the most severe droughts over Hawaii in South and West Maui (where Lahaina is located). It is likely that the drought conditions combined with an abundance of fuel from the wet February and spring were contributory factors in the severity of the Lahaina wildfire.
The Copernicus Climate Change Service produces monthly seasonal forecasts from many different weather forecasting centres to help us understand possible future conditions around the globe.
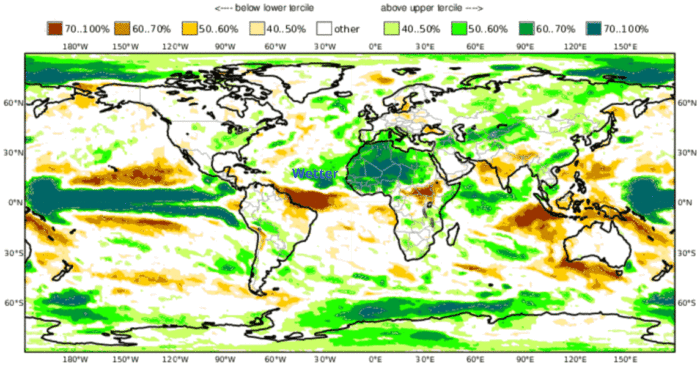
The chart below shows the expected rainfall through the months of September to November from five different seasonal forecast models. Greens show rainier conditions, brown shows drier conditions. The rainier conditions can be indicative of increased tropical cyclone activity. This year we have an El Nino – that usually weakens hurricane activity – but a warm Atlantic, that can increase activity. So, any indications of what is come in such a difficult year to forecast are always useful.
It’s interesting to note the green, wetter region across the Tropical Atlantic. However,this region exists more towards the central / eastern Atlantic, which may be indicative of a busier hurricane season here, but this anomalous wetness is reduced towards the eastern seaboard of the US – although rainfall is still expected to be slightly above average here. All to play for with the three key months ahead – but will we be spared hurricane landfalls with a busy tropical season staying over the sea?
Hurricane Season 2023: Half-Term Report

Hurricane Season 2023: Half-Term Report
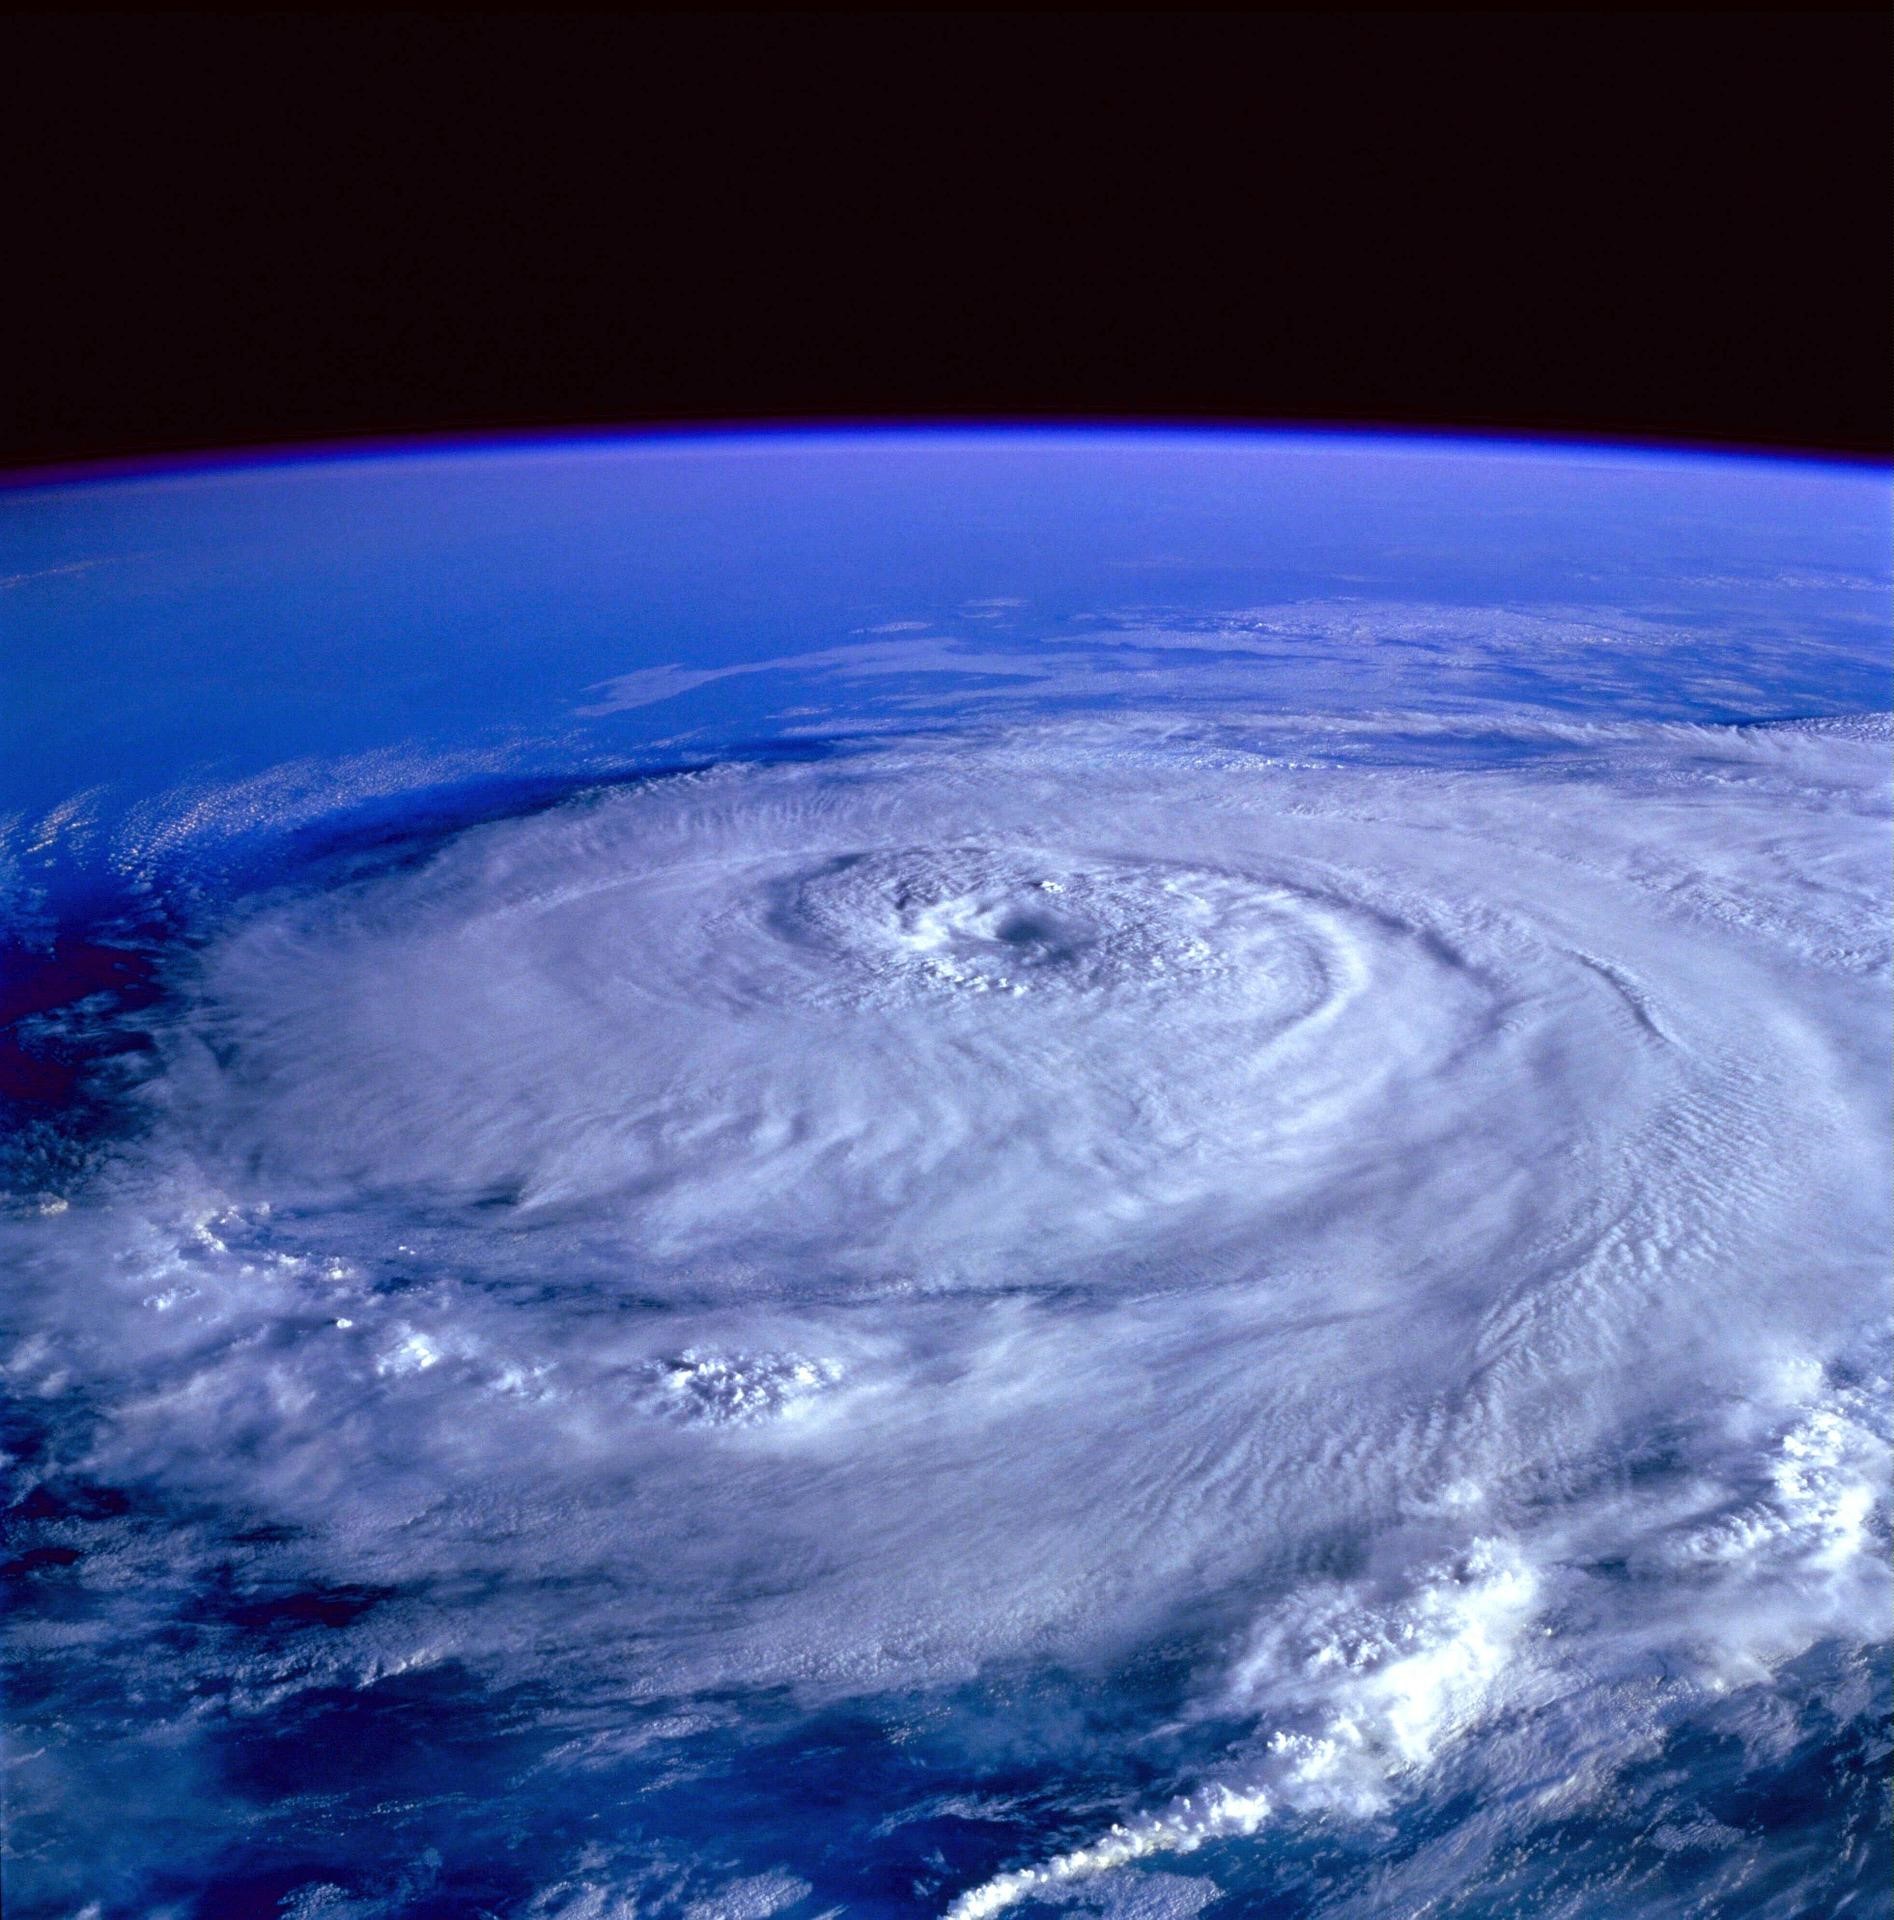
We’re now past the climatological peak of the hurricane season: half term, if you like. As we approached the hurricane season, a lot of the discussion was around the battle around El Nino versus a warm Atlantic. So, how are things panning out: and how might this impact our perspectives on present-day risk more broadly?
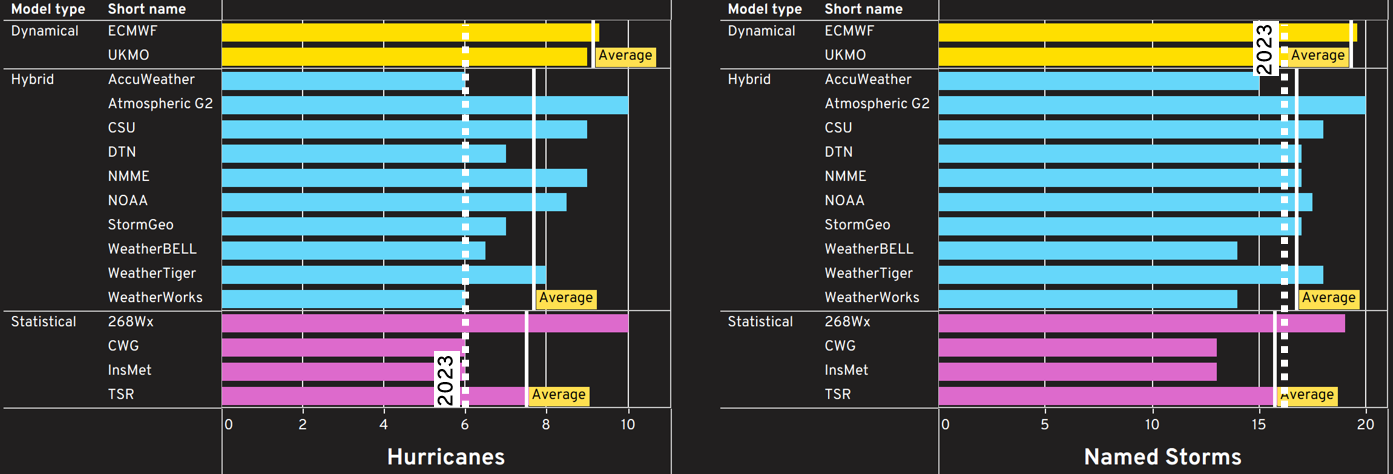
Heading back to July, the forecasts from the usual forecasting centres – collated conveniently for us by the Barcelona Supercomputer Centre – pointed to broadly an above-average season, with an average of between 7-9 hurricanes. The chart below shows the forecasts split depending on the type of forecasting system: Dynamical (full weather forecast style numerical simulation), Statistical (as it sounds, using historical statistical relationships to forecast the season) and Hybrid (a mixture of Statistical and Dynamical).
Many of these forecasts tend to shy away from the all-important landfalling information as it’s likely such a difficult task. It was interesting however that the two dynamical models were towards the higher end of the forecast range for both hurricanes and tropical storms. We’ve still got some of the season to go, but were they on to something here?
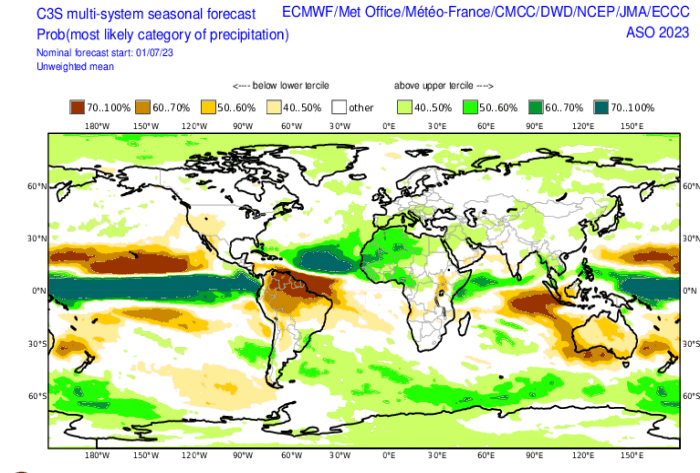
Digging further into these dynamical forecasts, the seasonal dynamical weather prediction models available at the Copernicus C3S forecast website pointed to a possible trend to the hurricane tracks this year. The chart below shows the anomalous nature of rainfall in the forecasts during August to October that gives a hint towards where they felt elevated tropical cyclone activity might occur. Many of the models pointed to elevated rainfall (and therefore, potentially, tropical cyclone) activity in the East of the Atlantic Basin with maybe more-normal conditions more towards the Eastern seaboard of the US. This is shown in the chart below as the area of dark green in the tropical Eastern Atlantic opposed to the lighter greens and whites close to the US seaboard indicative of possibly closer to average tropical cyclone activity.
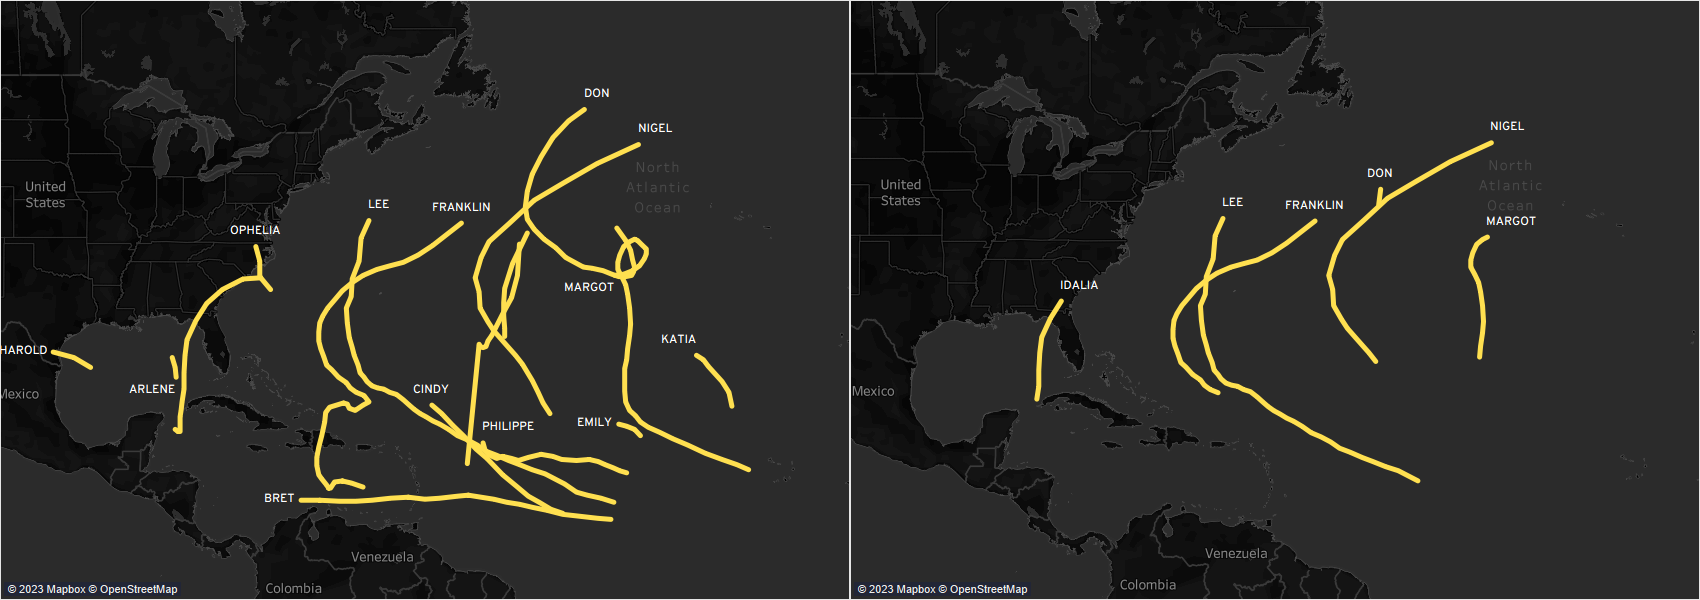
Holding this in mind, it’s been fairly interesting to note how much of the activity has been more towards the East of the Atlantic basin if we look at the tracks of at least tropical storm strength (left) and hurricane strength (right). Maybe the models were on to something here?
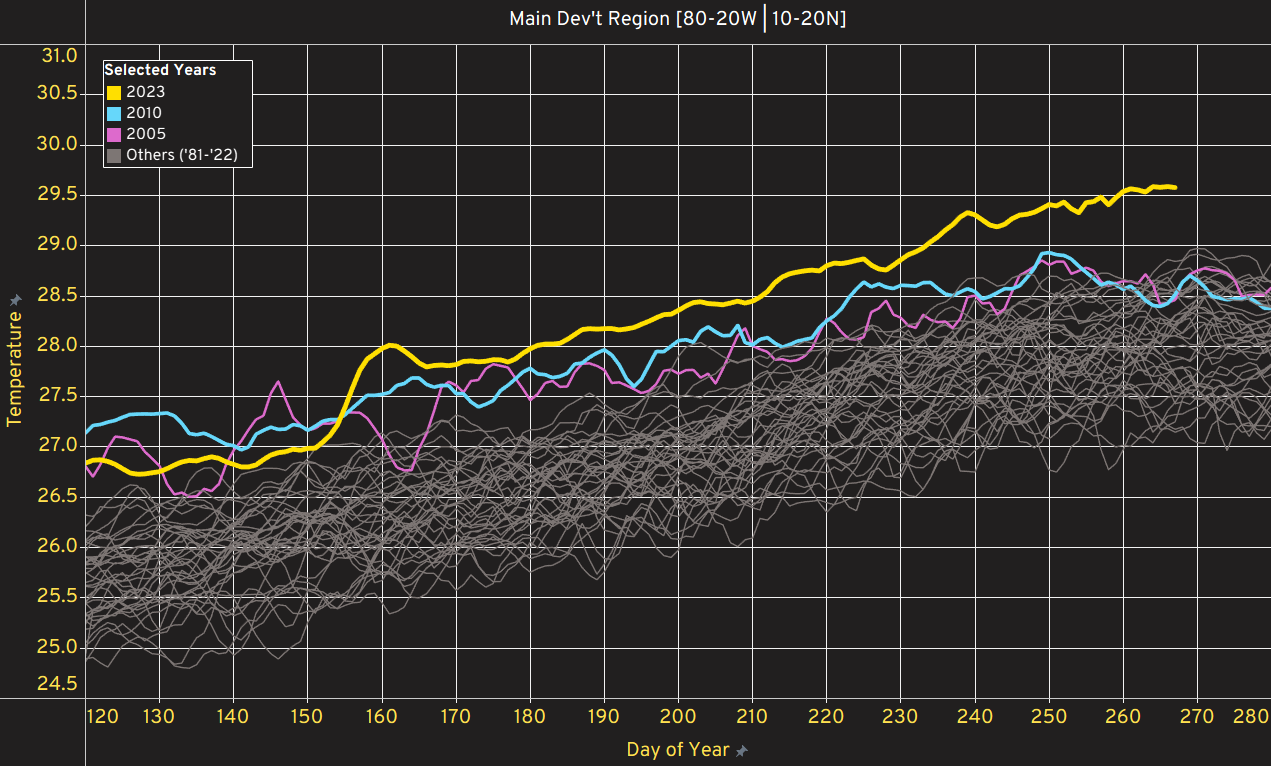
The main talking point however was the Battle Royale involving the El Nino Southern Oscillation (ENSO) being in a warm phase (El Nino) and the extra-warm seas in the Atlantic. The warming of the sea to record levels during this hurricane season – the chart below showing how warm the Atlantic Main Development Region (through which a large proportion of landfalling storms pass) has become during this summer – has been quite a talking point, especially whether this warmth would act to override the usually developmentally-prohibitive atmospheric environments for Atlantic hurricanes that a strong El Nino can lead to.
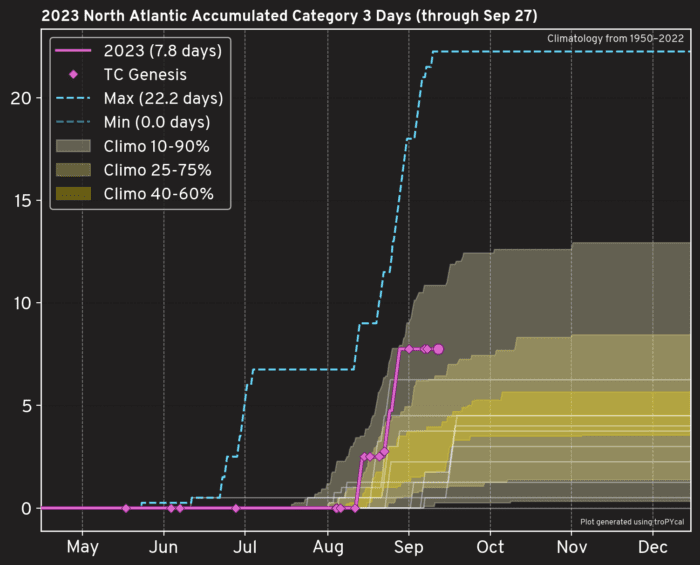
How the season has panned out from a risk perspective can be summarised by the chart below which has a number of elements to it to describe this season. Given that losses in the EP curve above 1-in-5 are typically dominated by the Category 3+ storms, the chart below shows cumulative count of “Category 3 days” – days where a Category 3 storm has existed in the basin – for hurricane seasons since 1950. This season sits between the 75th and 90th percentile of Category 3 activity: and this is for a year where El Nino might be expected to suppress major hurricane activity.
Also, we can contrast the pink line to the white lines on the chart that show all the El Nino years. This year has already the highest Category 3 days of any El Nino year since 1950. Maybe those warm seas this year really have eradicated (or at the very least, counterbalanced) the ameliorating effect of an El Nino event. Conventional thinking often points to hurricane seasons during El Nino years typically being quite stunted owing to the strong vertical shear in the basin inhibiting tropical development. This – so far – has been far from the case this year.
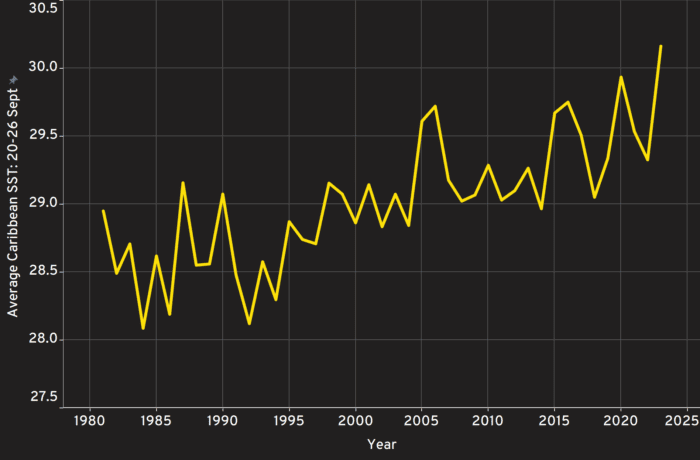
The remainder of the season has plenty of interest, too. As the African Easterly Wave activity dies down and we get fewer storms forming and moving across the Atlantic, most activity tends to be born within the Caribbean. In a year of warm seas in the Atlantic, the chart below should come as little surprise: the Caribbean is at its warmest in 40 years at least, which will keep eyes focussed on activity for the coming month at least.
But what of the bigger picture? It’s often useful to consider a single season in the grand scheme of things.
In understanding the role of La Nina or El Nino when seas are increasingly warm, ongoing work that Inigo have been doing in partnership with Reask has been trying to understand the relative importance of natural variability in the presence of warming seas. Their modelling setup is intimately linked to climate model output so we are able to assign a moving time base to simulations to help us understand how sensitive hurricane seasons might be to the various factors that change year-in, year-out like ENSO but also the factors that might be permanently changing like rising sea surface temperatures.
The chart below shows the hurricane season activity in simulated hurricane seasons as a function of the sea surface temperature in the Atlantic Basin, with the seasons split into three broad states: El Nino, La Nina and neutral ENSO conditions.
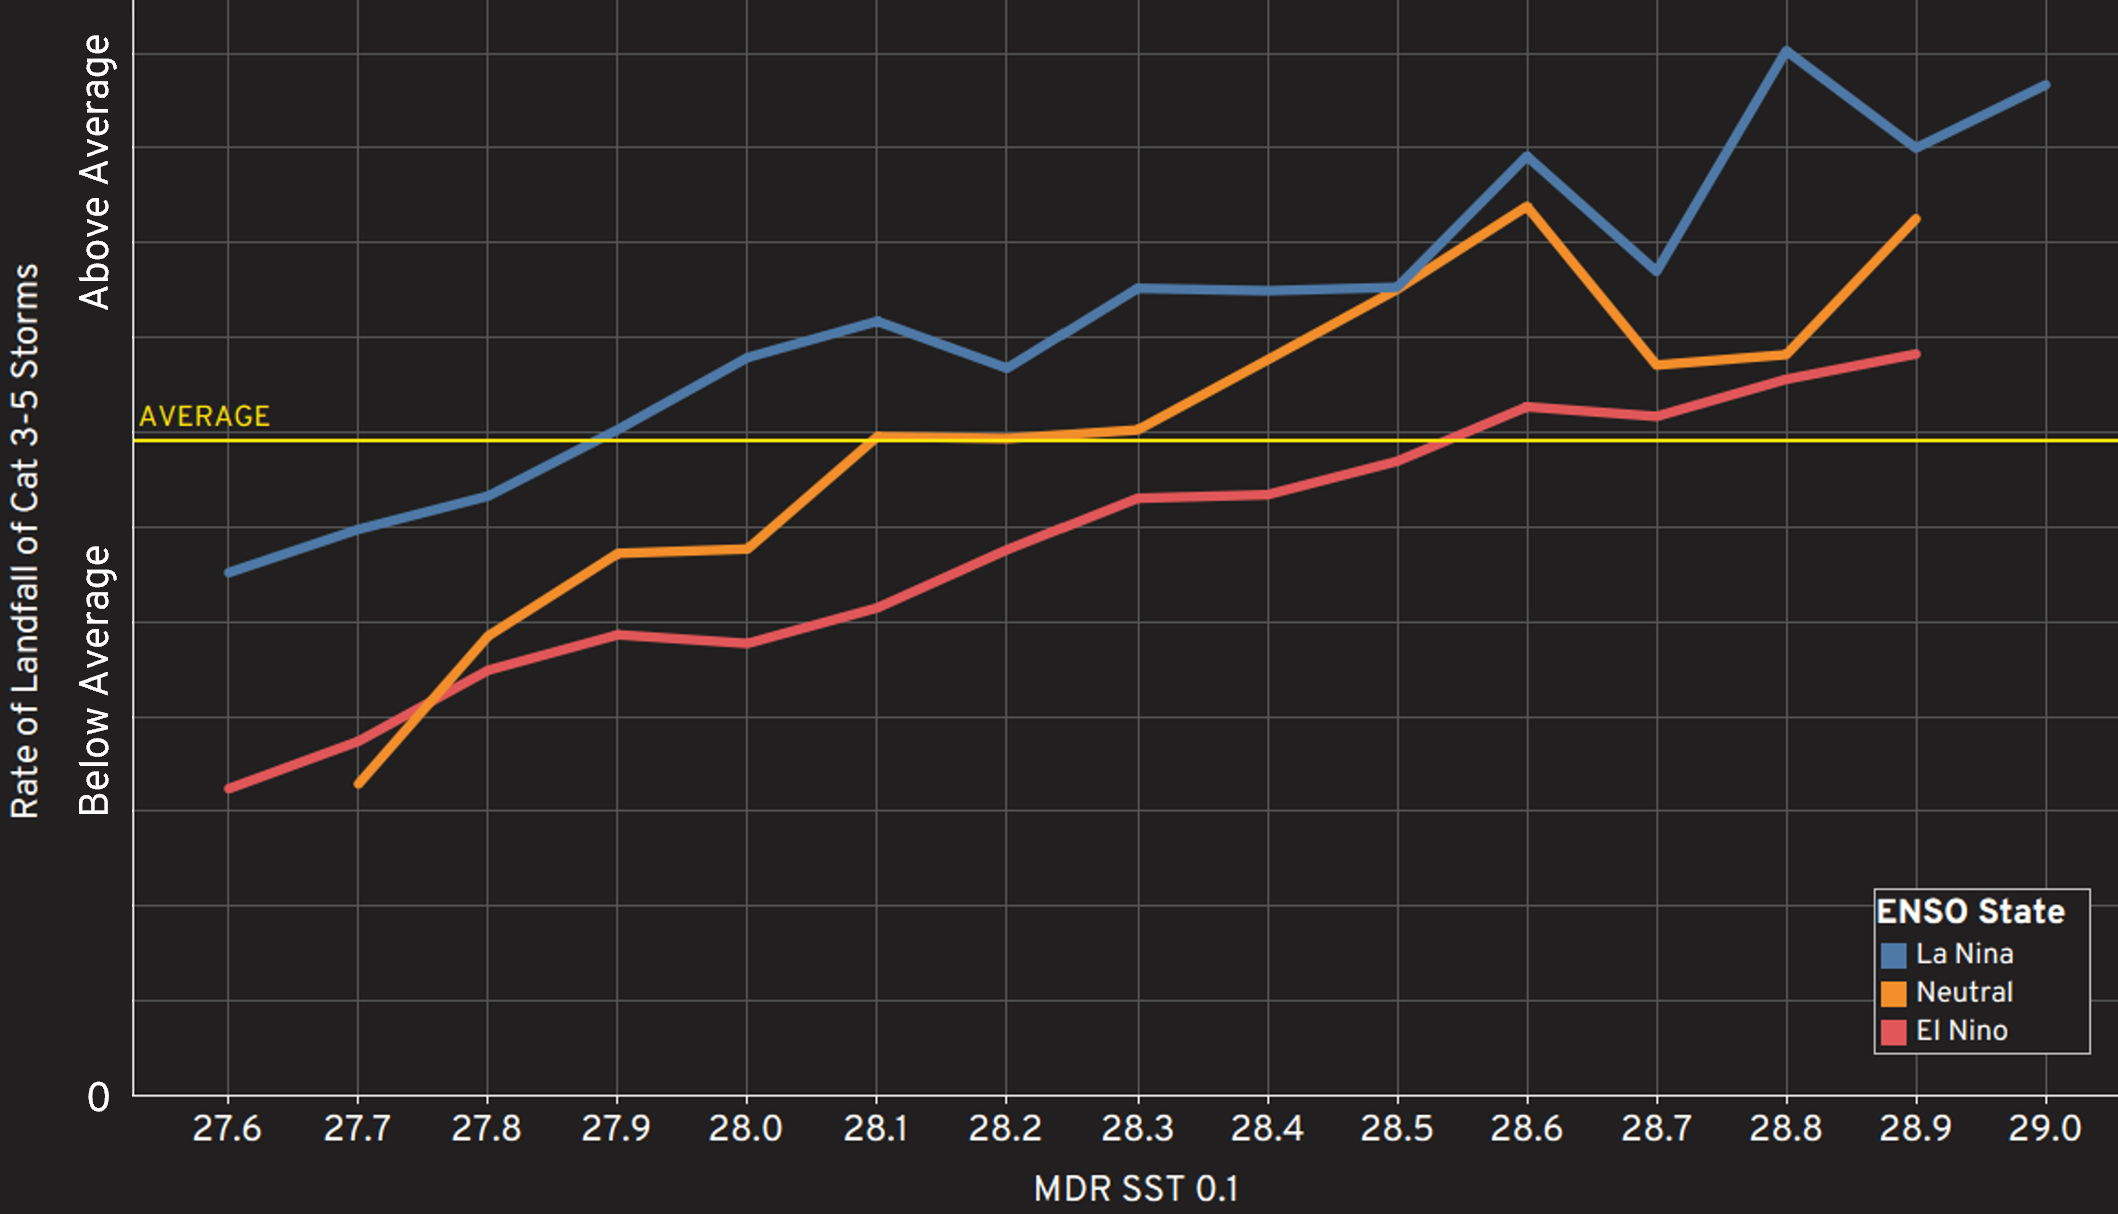
There is an interesting tipping point in the data above: a certain sea-surface temperature in the simulations where the seasonal frequency of the important Cat 3-5 storms is always above average, irrespective of the ENSO state, as can be seen in the right-hand side of the graph above where the all three ENSO states have, on average, above-average major hurricane frequency. This is certainly food for thought in an era where seas are warming – with this year being excessively warm and potentially akin to what we might typically see in the future.
Ensuring we are getting the risk right in the present day is paramount and this season is acting as another useful data point in our comprehension of how risk might be changing in a warming world.



 Richard Dixon Introduction
  Jeongmin Han Introduction
  Ruth Petrie Introduction


